(SOUTHERN COLORADO) — As the fall season continues to transition into the colder months of the year, we are starting to see more dips of the jet stream and more storm systems make their way into the Colorado geographical region. With that being said, the FOX21 Storm Team makes it their duty to illustrate the scene and portray the “why” behind the weather using a variety of tools that can help enhance the understanding of the forecast, but also aid in understanding the weather patterns we are seeing. Let’s run through just a couple of tools we may show you as we are on the air.
For one, you have probably seen us show a map of the entire continental United States with lines going across (pictured below). Those lines are called “heights” and are areas of equal pressure at 500mb. Being at 500mb, means being roughly 18,000 feet up in the atmosphere. These lines give us a scope on how the jet stream is behaving, and show us areas of high pressure and low pressure, or troughs and ridges.
Now let’s beef up the map just a tad and add colors. You have probably seen the map overlayed with a turquoise color (pictured below). This overlay shows the wind speed at 500mb; the same level as portrayed in the earlier map. The lighter the turquoise shades, the faster the wind is, giving us an idea and depiction of where there are possible jet streams–or faster-moving winds aloft. This tells us where we can expect storm development just based on the “lift” this feature provides.
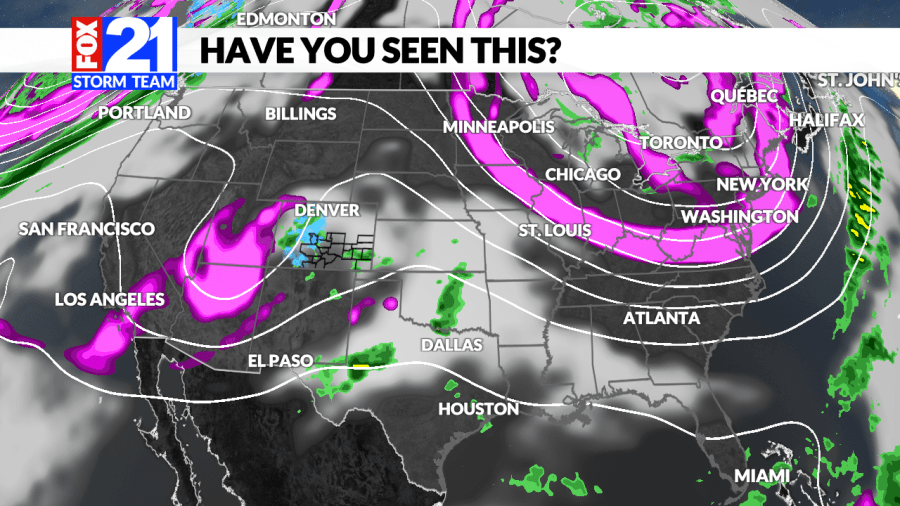
Moving on to the pink shades on the map (pictured below). This one is also located at 500mb, and the pink shade is known as “relative vorticity.” Relative vorticity is how much spin there is in the atmosphere aloft. This gives a good scope into where we can expect shortwaves and disturbances, or in other words, areas of storm energy to occur.
As we continue into the year and have more active weather on the way, these maps will frequently be used. These tools are beneficial in understanding how the atmosphere works, but also create a visual for the viewer at home to understand the why behind the forecast and what we are seeing on the ground.